
A location brief your leadership can act on.
A location report puts cities on the same page: where hiring concentrates, what the same role costs in each, which states offer what and who already operates there. It ends with the questions to settle before a recommendation, so the report is a starting point for a decision and not a verdict.
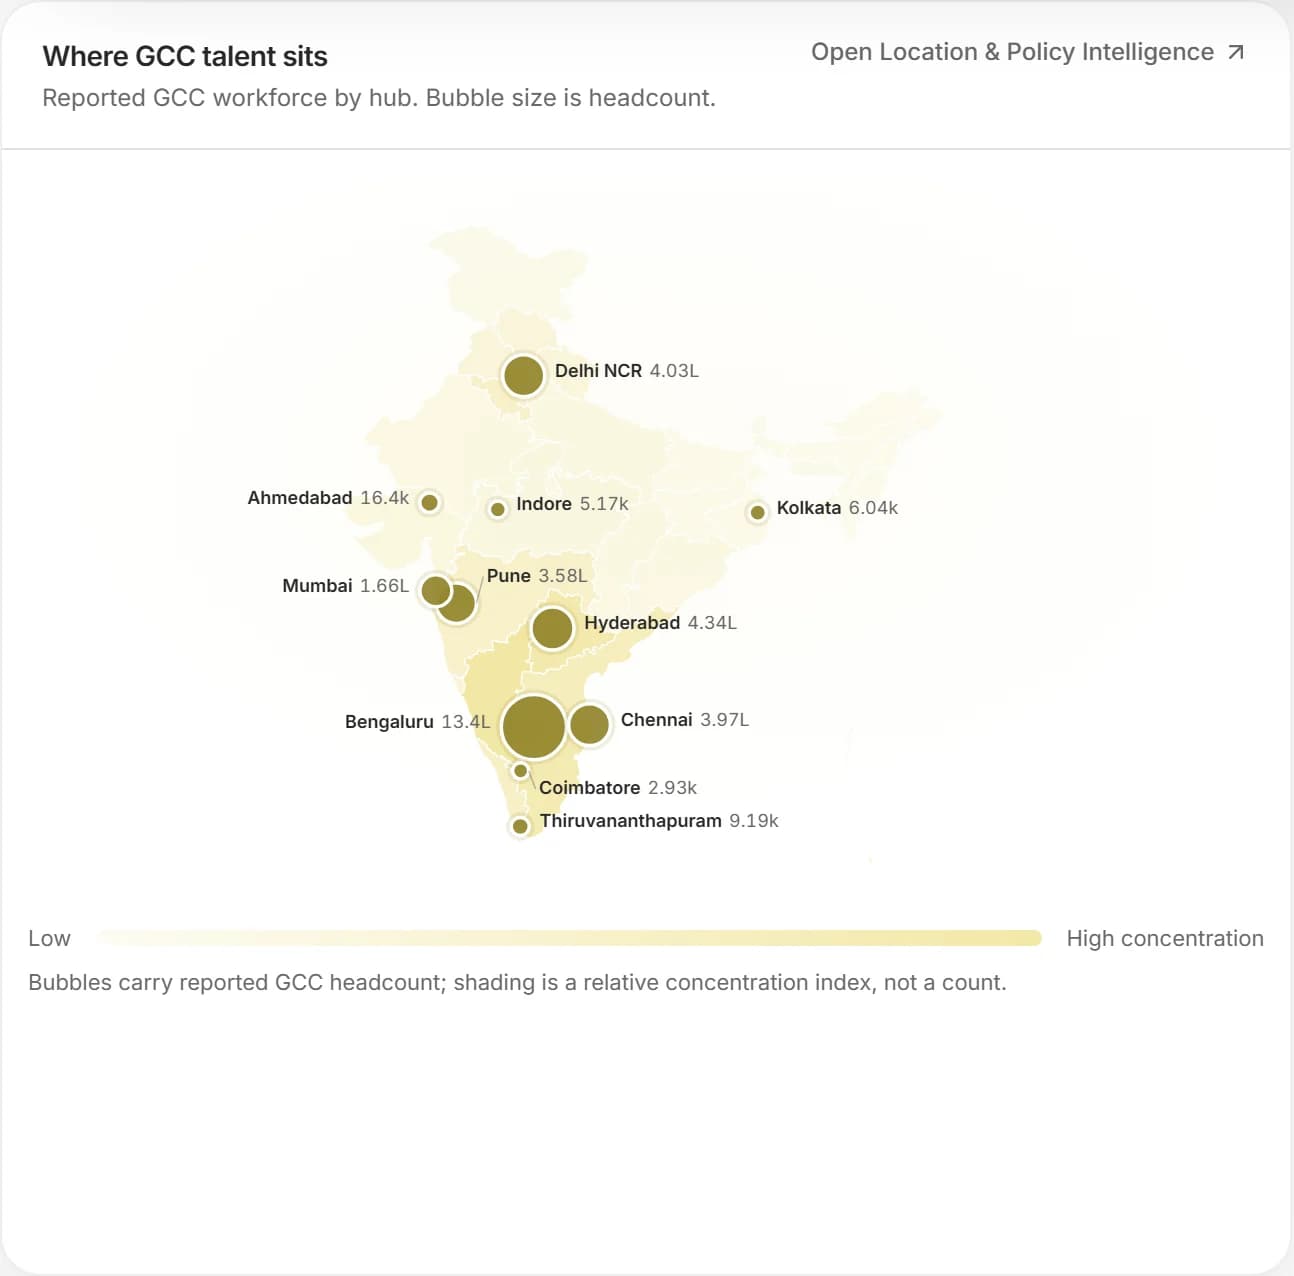
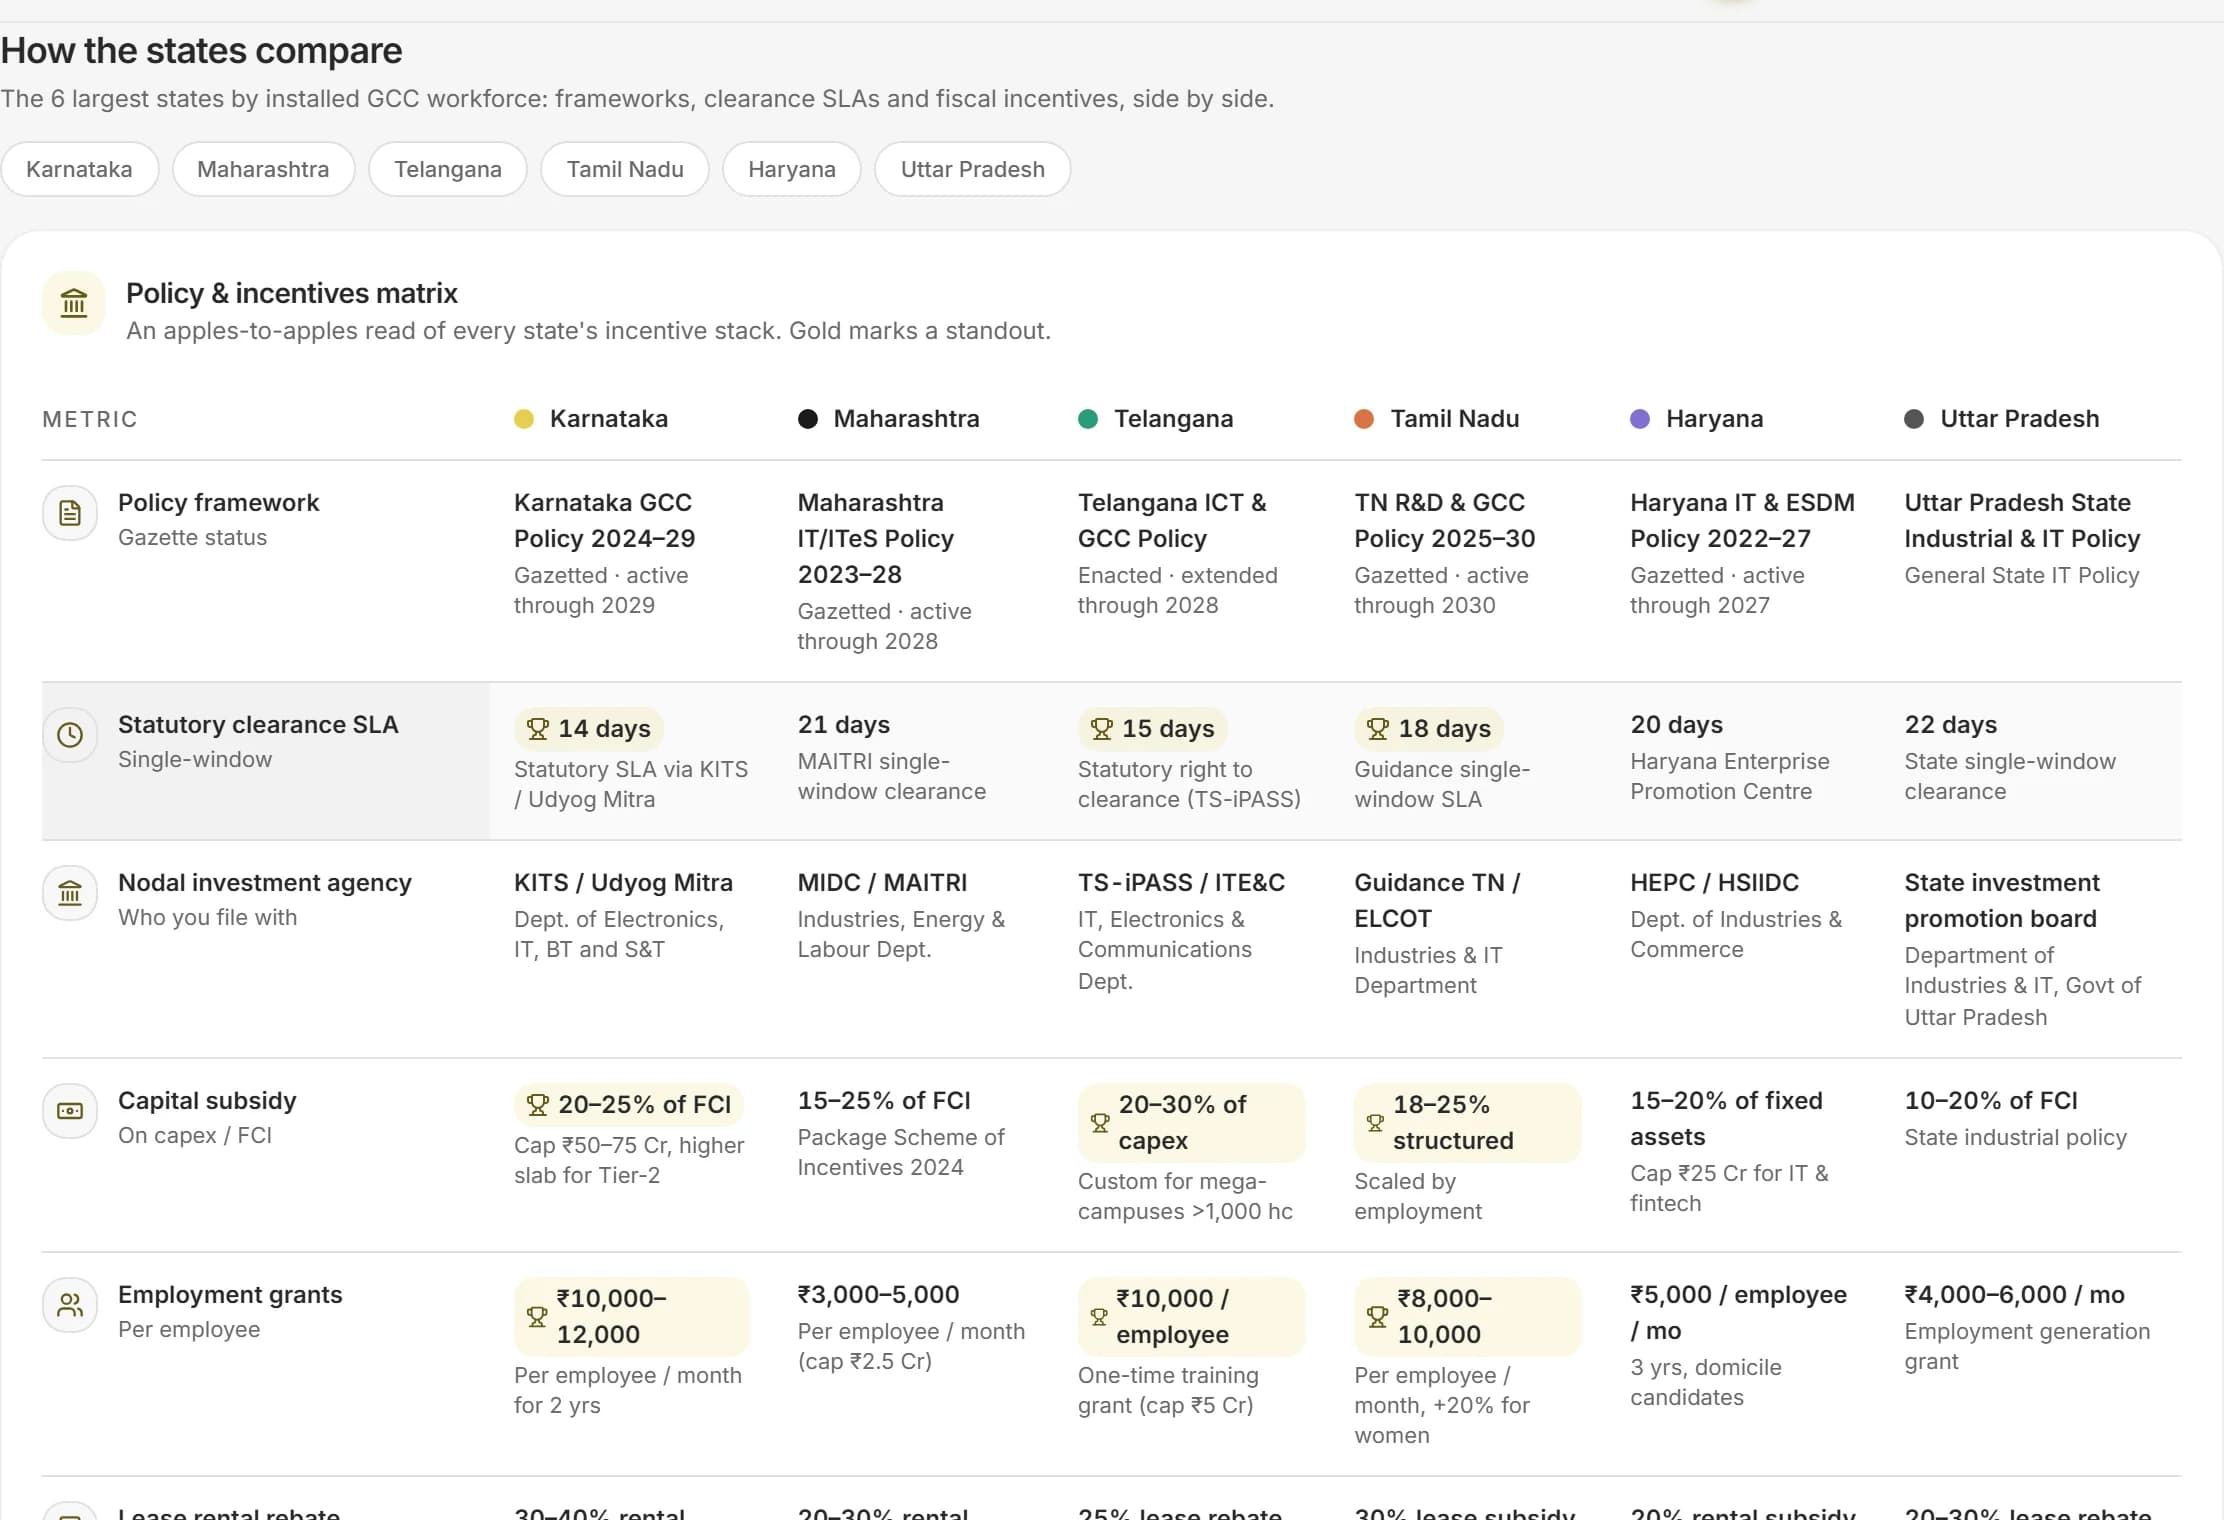
- Hiring concentration across the cities in scope
- Annual pay for the same role and band in each city
- The questions to settle before a recommendation
The GCC list this page draws on.
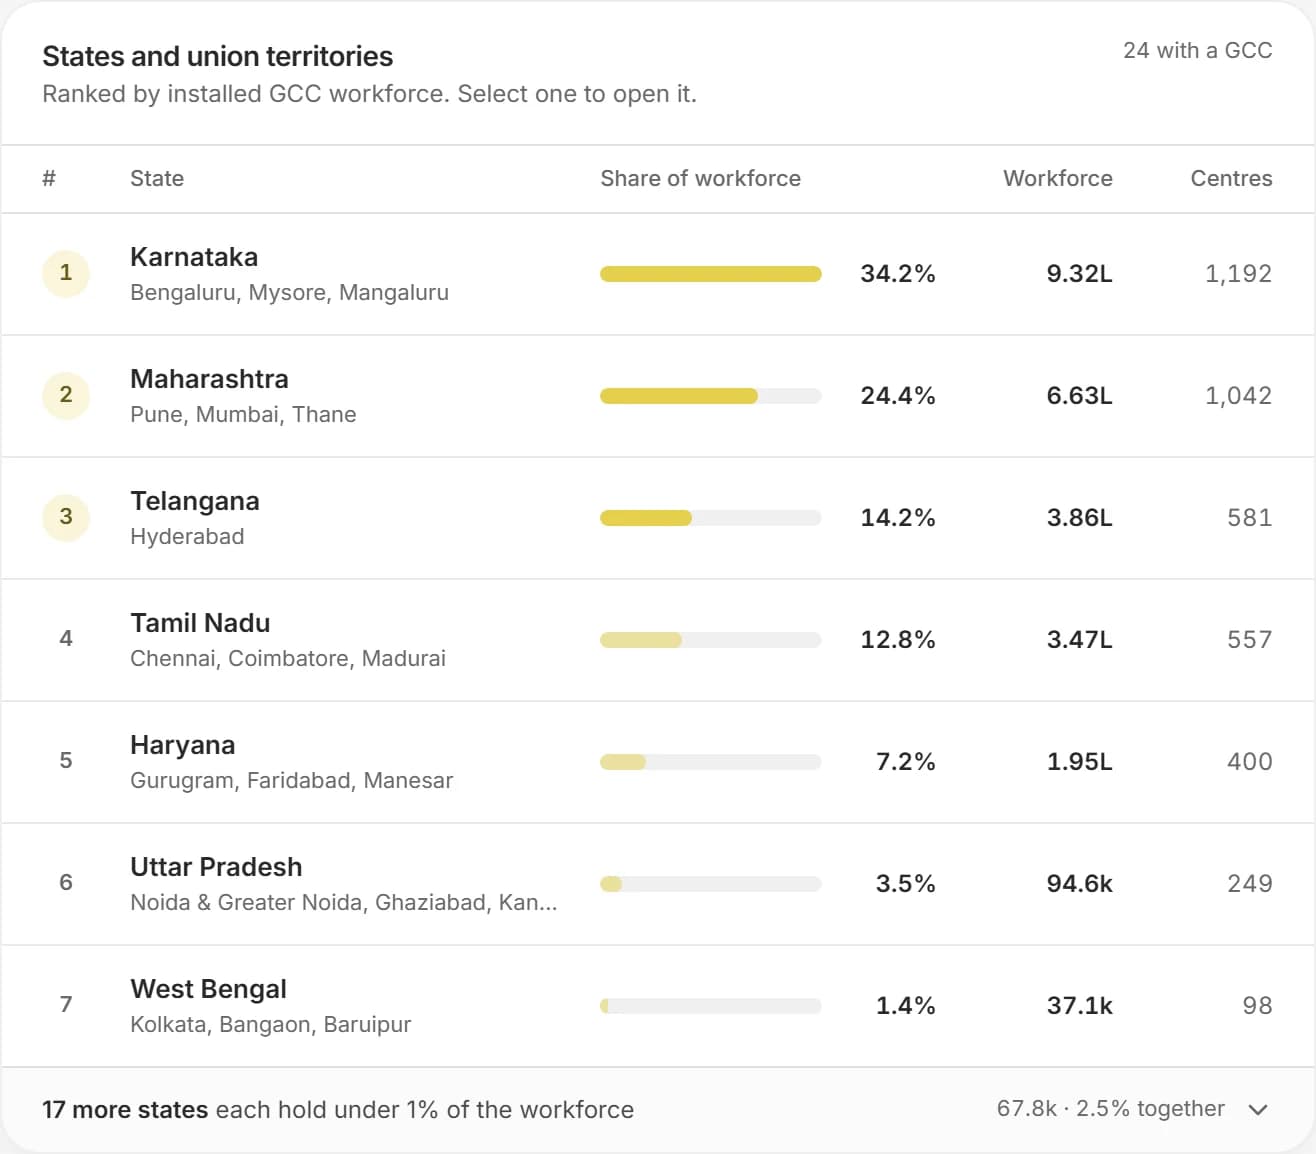
States ranked by installed GCC workforce.
A screen from the product itself. The counts beside it are read from the platform directory.
- 2,500
- company profiles
- 35
- Indian cities with a centre
- 28
- documented build journeys
- 1,296
- companies with pay benchmarks
Location Reports, in four parts.
Each part is something the product does today, with the data it uses named on the page.
Hiring concentration
Posting volumes across the cities in scope for a consistent window, so scale is comparable between hubs.
Pay by city
Median CTC for one role and one experience band in every city, ranked, with the spread against the top city.
State policy and peers
Incentive terms by state and the peer centres already operating in each city.
The decision frame
A closing page that sets out where to build, what to build, what to pay and whom to source, with the evidence for each.

From a sentence to a finished report.
Reports draw on the same evidence as the rest of the platform, so a figure in a report matches the figure on the page it came from, and each one names where it comes from. The report is the last step of a decision, not a separate product.
Request access- 0.00M
- GCC workforce on the list
- 0.0%
- Of the workforce is in Bengaluru
- 0
- With a recorded setup year
- 0
- GCCs set up since 2021

How a location report reads
The page order follows the order of the decision.
- Step 1
The question
A cover that names the cities and the capability.
- Step 2
Hiring concentration
Where the demand sits, comparable across hubs.
- Step 3
Pay by city
One role, one band, every city.
- Step 4
Before a recommendation
The four answers that must agree.
Ask the question the way you would ask a colleague.
These are the kinds of questions this page is built for. Each one is answered from the data on it, not from a general model of the market.
Which of three cities has the deepest hiring activity for our capability?
What is the pay gap between the cheapest and the dearest of them?
Which of our competitors already operate there?
What do the states offer?
What are the open questions before we recommend a city?
From first look to a decision you can show.
Name the cities
Two to six places in the prompt, or choose them in the plan.
Set the role
The capability and experience band the comparison is built on.
Generate the brief
Pages for hiring, pay, policy and peers are assembled.
Present
Download the PDF or the PowerPoint for the meeting.
Built for the people who own the decision.
Site-selection teams
A comparison that can go to leadership as it is.
GCC heads
A structured case for the next city.
Advisors
A fast evidence base for a client conversation.
What is in it, and what is not yet.
We say plainly what the data holds today and what we are still adding, so nothing here is implied.
- Hiring concentration by city
- Pay by city for a role and band
- State policy and peer footprints
- A decision framework page
- Lease cost per seat
- Attrition by city
The terms on this page, defined.
Every figure on a CapSight page comes with its definition, so you never have to guess what a number is counting.
- GCC
- A Global Capability Centre: a centre a company runs in India for its own global work, such as engineering, analytics, finance, operations or support. It is part of the company, not an outside vendor.
- Platform Industry
- The one industry grouping CapSight uses for every company, so a filter or a chart means the same thing on every page. There are 10.
- Tier 1 and Tier 2 cities
- Tier 1 is the eight established hubs: Bengaluru, Chennai, Hyderabad, Mumbai, Pune, Delhi NCR, Kolkata and Ahmedabad. Every other city is Tier 2.
- Designed report
- A report laid out as a finished document, with charts and a written read-out, that you can open, download and present, not a table export.
- Company dossier
- One company's profile set out as a report: who it is, how large its India presence is, how it is organised and how it pays.
- Source line
- The note under a figure that says where it comes from, so a number in a report can be traced back to the evidence behind it.
Before you ask.
How many cities can a report compare?
Several. The plan lets you choose more than one location.
Does it recommend a city?
It sets out the evidence and the questions to settle first; the recommendation is yours.
Which pay figure does it use?
The default 4-to-8-year band unless you choose another, and the band is printed on the page.
Bring the GCC decision you are working on.
Where to put the next 300 engineers, what a peer pays its architects, who owns the charter you are selling into. Ask it in CapSight, and see the market, the peers and the people behind the answer.
Already on CapSight? Sign in
- 01Request access
We set up your organisation and its admin, who adds the team.
- 02Ask the question you have
Market, peer, pay or people, answered from one dataset.
- 03Walk it through with us
A 30-minute session with the research desk, on your decision.

Capability maturity of five BFSI GCCs in Bengaluru, by function.
Illustrative example