
See how the ones that did it, did it.
The most useful evidence for a first centre is another company's first centre: where it opened, what the first team did, how it grew and what it cost in years. CapSight documents twenty-eight of those journeys, each as a timeline in which every figure carries its source and every gap is marked as not disclosed.
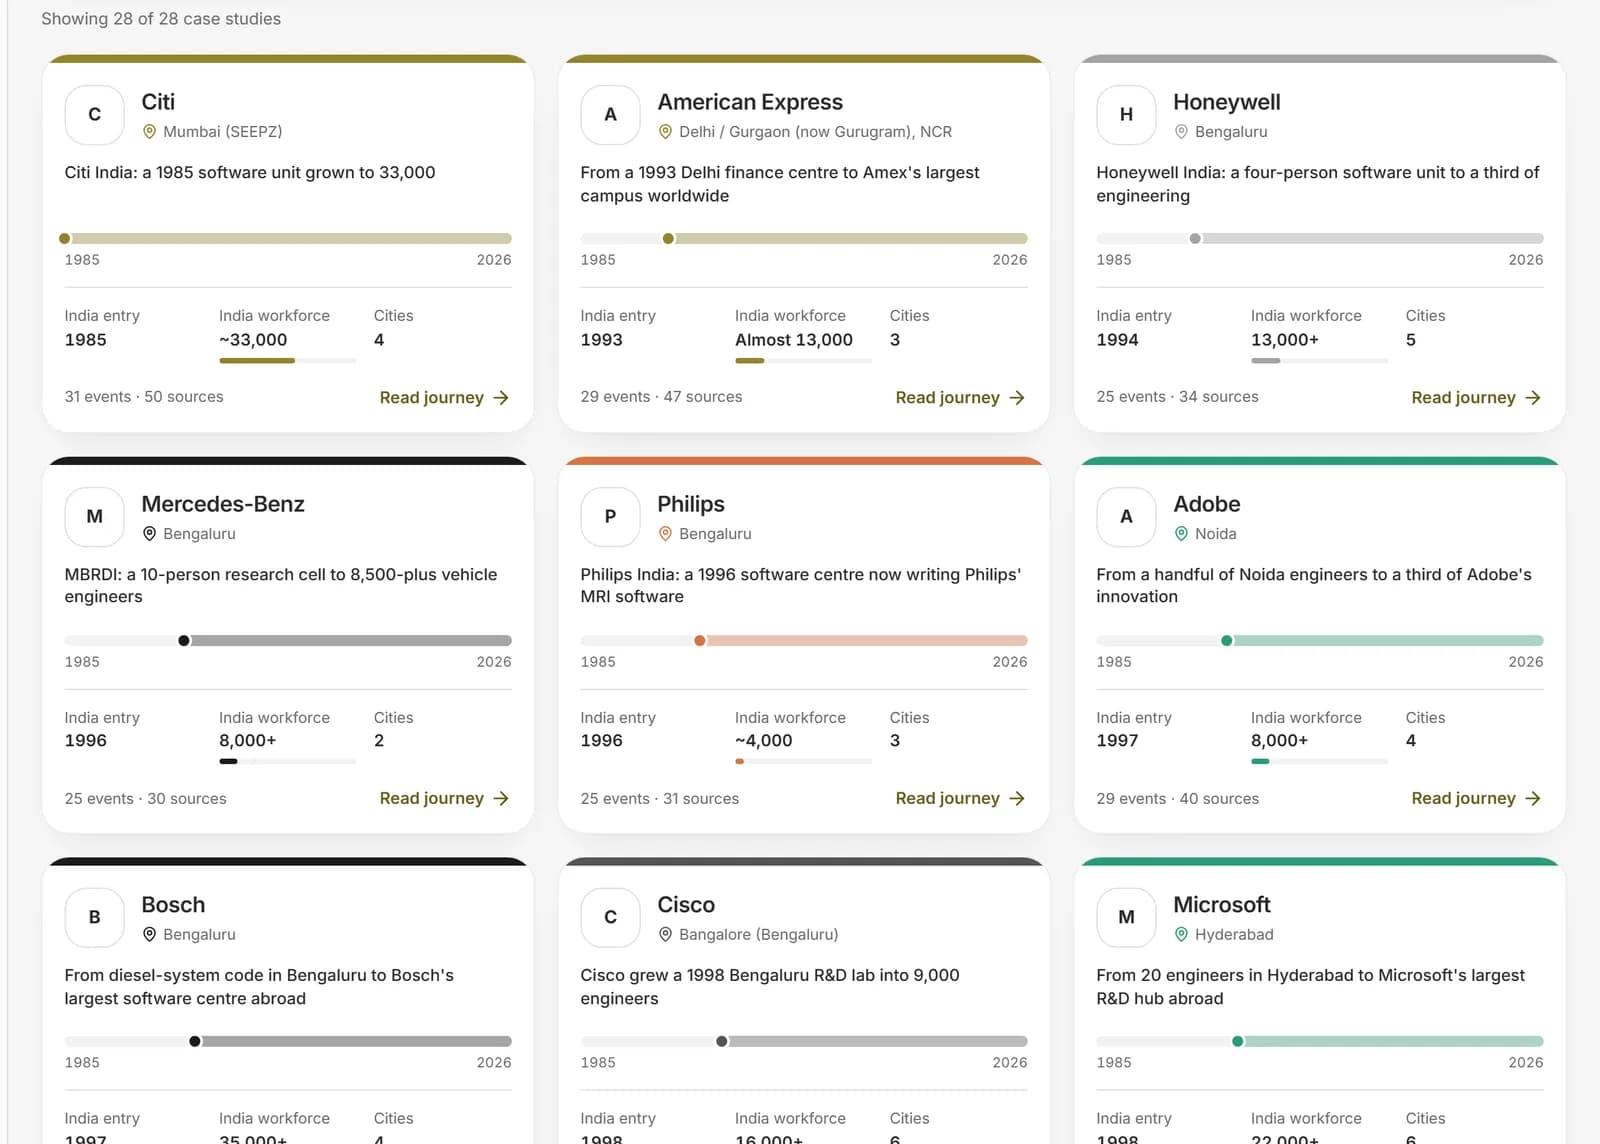
- 28 documented build journeys
- Every figure linked to its source
- Gaps marked, never estimated
The GCC list this page draws on.
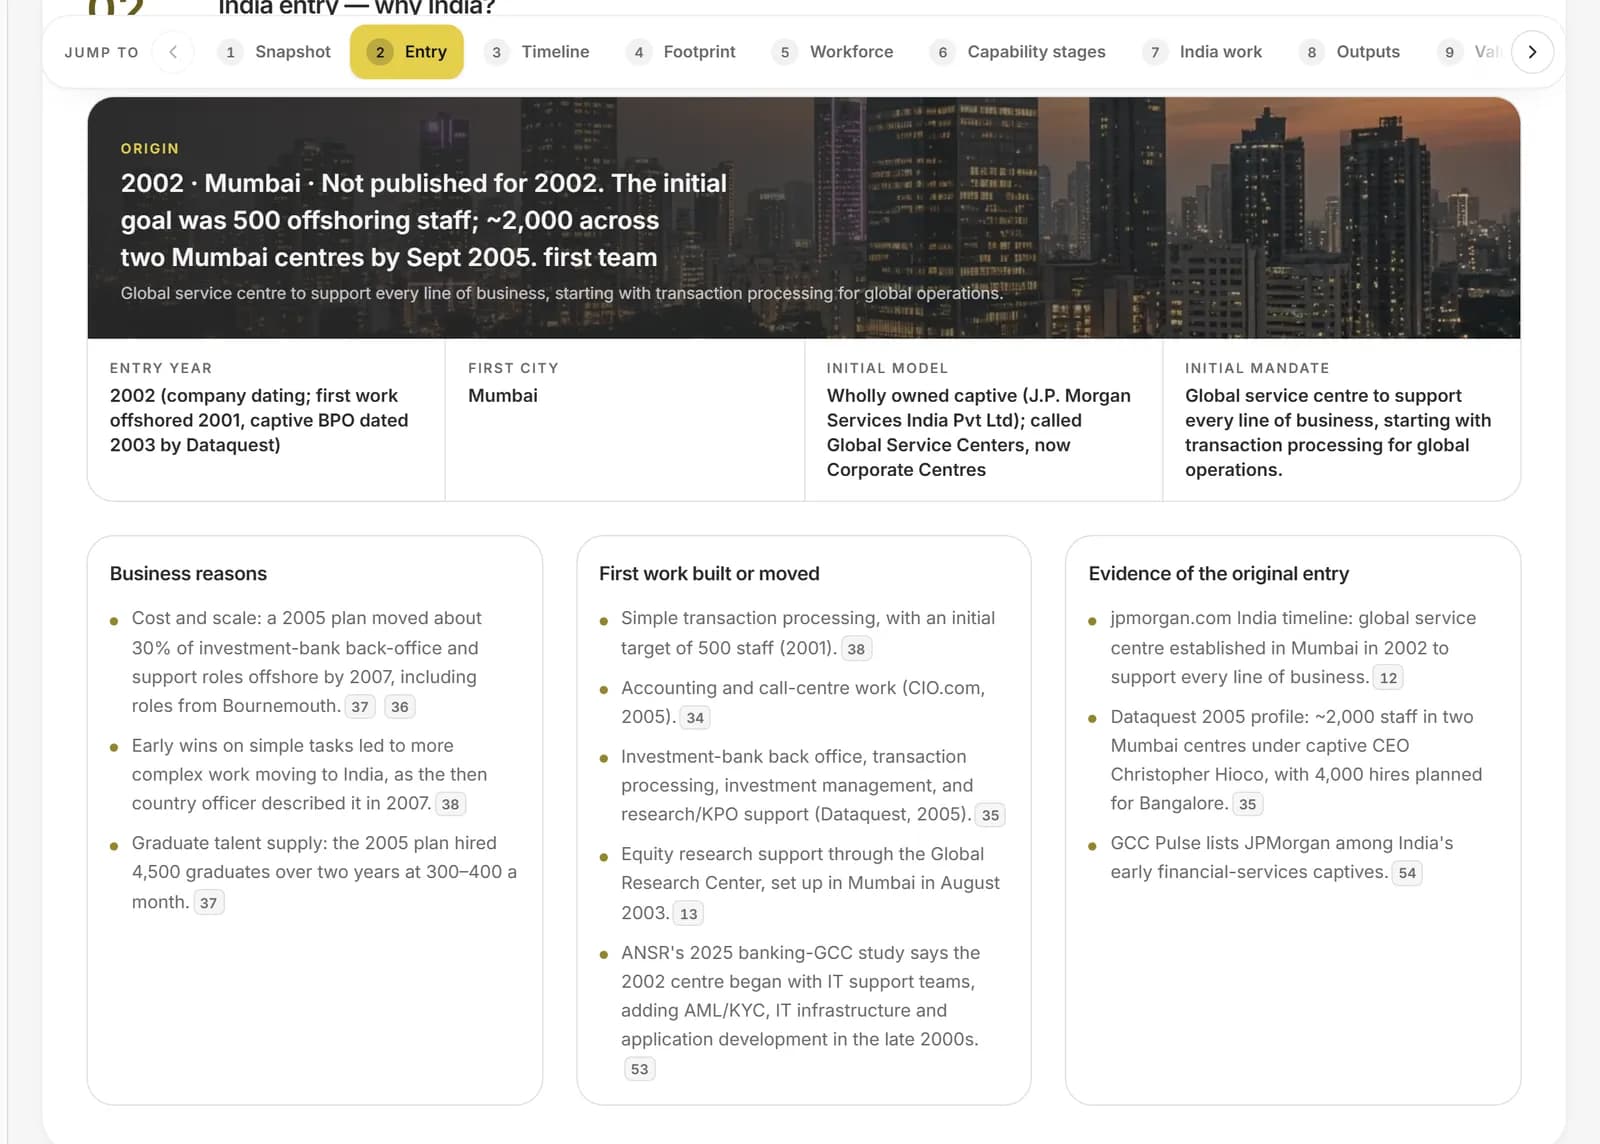
Why they came, where first, and what the first team did.
A screen from the product itself. The counts beside it are read from the platform directory.
- 28
- documented build journeys
- 2,500
- company profiles
- 35
- Indian cities with a centre
- 1,895
- with a recorded India setup year
Learn from Journeys, in four parts.
Each part is something the product does today, with the data it uses named on the page.
The first move, in detail
The year, the first city, the first mandate and the first team size where it was published, together with the business reasons behind the decision to come.
A timeline with receipts
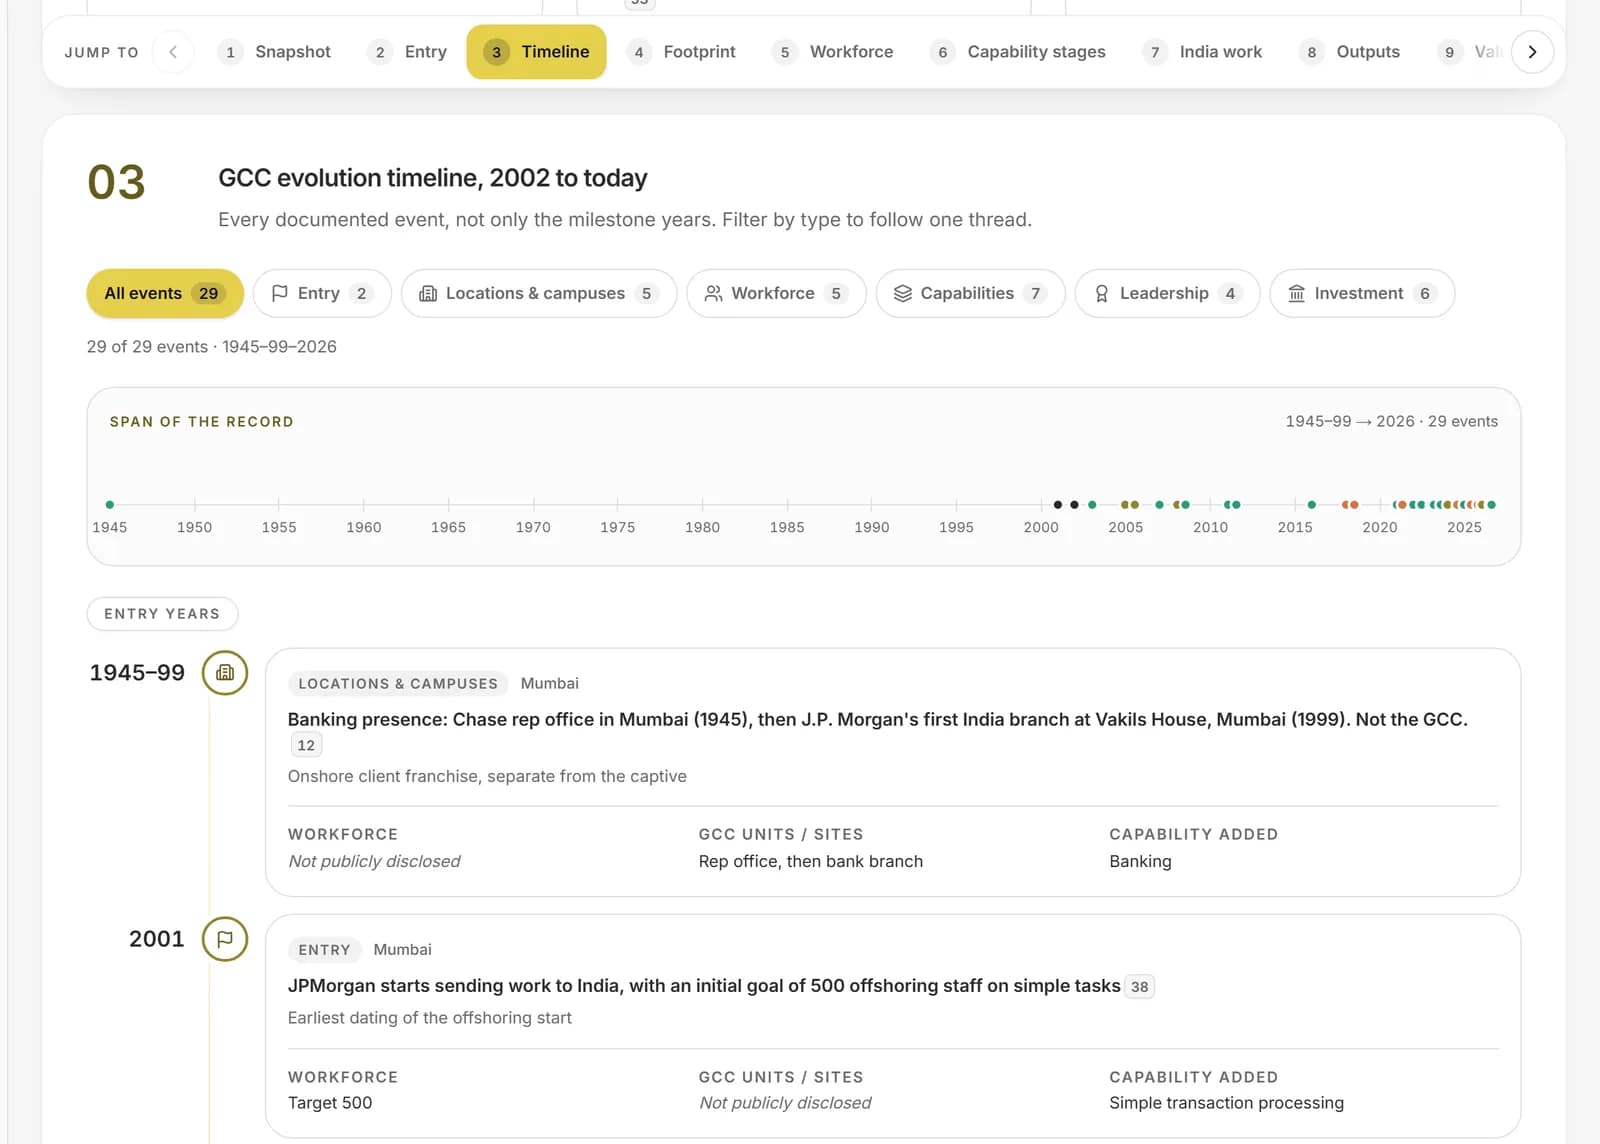
Every milestone in order: new sites, workforce steps, capabilities added, leaders appointed. Filter by type, and open the source behind any entry.
Footprint and workforce over time
How the centre spread across cities and how its headcount grew, set beside the capability stages it passed through.
What it delivers today
The work now done in India, who consumes it globally and what that is worth to the parent, so you can judge the end state as well as the start.

One market, twelve decisions.
The same list of GCCs, the same cities and the same pay benchmarks sit under every solution, so where to build, what to build, what to pay and whom to hire are answered from one set of facts that agree with each other.
Request access- 0
- GCCs set up since 2021
- 0
- States and union territories with a centre
- 0
- Companies with pay benchmarks
- 0.00M
- GCC workforce on the list
How a journey is laid out
Every journey follows the same chapters, so two centres can be read against each other without translating between formats.
- 01
Snapshot
The headline figures: workforce, entry year, cities, share of the parent's technologists.
- 02
Entry
Why the company came, where first and what the first team did.
- 03
Timeline
Every documented event, filterable, each linked to its source.
- 04
Footprint
The cities and campuses the centre spread across.
- 05
Workforce
Headcount over time, as published.
- 06
Capability stages
How the mandate moved from processing to engineering to ownership.
- 07
India work
What is delivered from India today.
- 08
Outputs
What the parent gets from the centre.
Ask the question the way you would ask a colleague.
These are the kinds of questions this page is built for. Each one is answered from the data on it, not from a general model of the market.
In which city did comparable companies open their first centre, and in which year?
How large was the first team, and how fast did it grow after that?
How long did it take a centre to move from transaction work to engineering ownership?
Which capabilities arrived first, and which came last?
How many cities does a mature centre span, and how did it add them?
What did the parent say publicly about why it came to India?
From first look to a decision you can show.
Browse the library
Filter the twenty-eight journeys by industry, or sort by how early each company entered.
Read the entry
See why the company came and what the first team did, with the evidence beside each claim.
Follow the timeline
Filter the events by type and follow the centre from its first site to its present scale.
Bring it to your plan
Use the comparable journeys as the precedent in your own build or expansion case.
Built for the people who own the decision.
Executives sponsoring a first centre
A precedent they can point to when the plan is challenged.
Strategy and transformation teams
The sequence peers followed, not a generic maturity model.
Analysts and researchers
A cited record of how centres were built.
What is in it, and what is not yet.
We say plainly what the data holds today and what we are still adding, so nothing here is implied.
- 28 documented build journeys across industries
- Entry year, first city and first mandate for each
- A filterable timeline of events with each figure linked to its source
- Figures not published are marked as not disclosed
- More journeys, added as they are researched
The terms on this page, defined.
Every figure on a CapSight page comes with its definition, so you never have to guess what a number is counting.
- GCC
- A Global Capability Centre: a centre a company runs in India for its own global work, such as engineering, analytics, finance, operations or support. It is part of the company, not an outside vendor.
- Platform Industry
- The one industry grouping CapSight uses for every company, so a filter or a chart means the same thing on every page. There are 10.
- Tier 1 and Tier 2 cities
- Tier 1 is the eight established hubs: Bengaluru, Chennai, Hyderabad, Mumbai, Pune, Delhi NCR, Kolkata and Ahmedabad. Every other city is Tier 2.
- CTC
- Cost to company: the annual total an employer commits to one person, shown in lakh rupees. One lakh is 100,000.
- Percentile band (P25, P50, P75, P90)
- P50 is the median: half the people in the sample earn less. P25 and P75 mark the edges of the middle half, and P90 marks the top tenth. A pay figure is always read with its band.
- Build journey
- A documented account of how a comparable centre started: its first city, its first team and how it grew, with each figure cited to its source.
Before you ask.
Where do the facts come from?
Published company statements, filings and news, each linked from the figure it supports. A figure with no published source is marked not disclosed.
Are the numbers estimates?
No. Where a number is a range or an approximation the company gave, it is shown as given, and a figure nobody published is left empty.
Can I request a company?
Journeys are added as they are researched. Ask your CapSight contact which centre you would like to see next.
Bring the GCC decision you are working on.
Where to put the next 300 engineers, what a peer pays its architects, who owns the charter you are selling into. Ask it in CapSight, and see the market, the peers and the people behind the answer.
Already on CapSight? Sign in
- 01Request access
We set up your organisation and its admin, who adds the team.
- 02Ask the question you have
Market, peer, pay or people, answered from one dataset.
- 03Walk it through with us
A 30-minute session with the research desk, on your decision.

Capability maturity of five BFSI GCCs in Bengaluru, by function.
Illustrative example