
Know the state, the city and the policy behind it.
Location is where cost, talent and incentives meet. CapSight profiles Indian states and cities, compares them side by side and keeps the policy and market signals that change the answer, from state GCC policy to announced new centres by city.
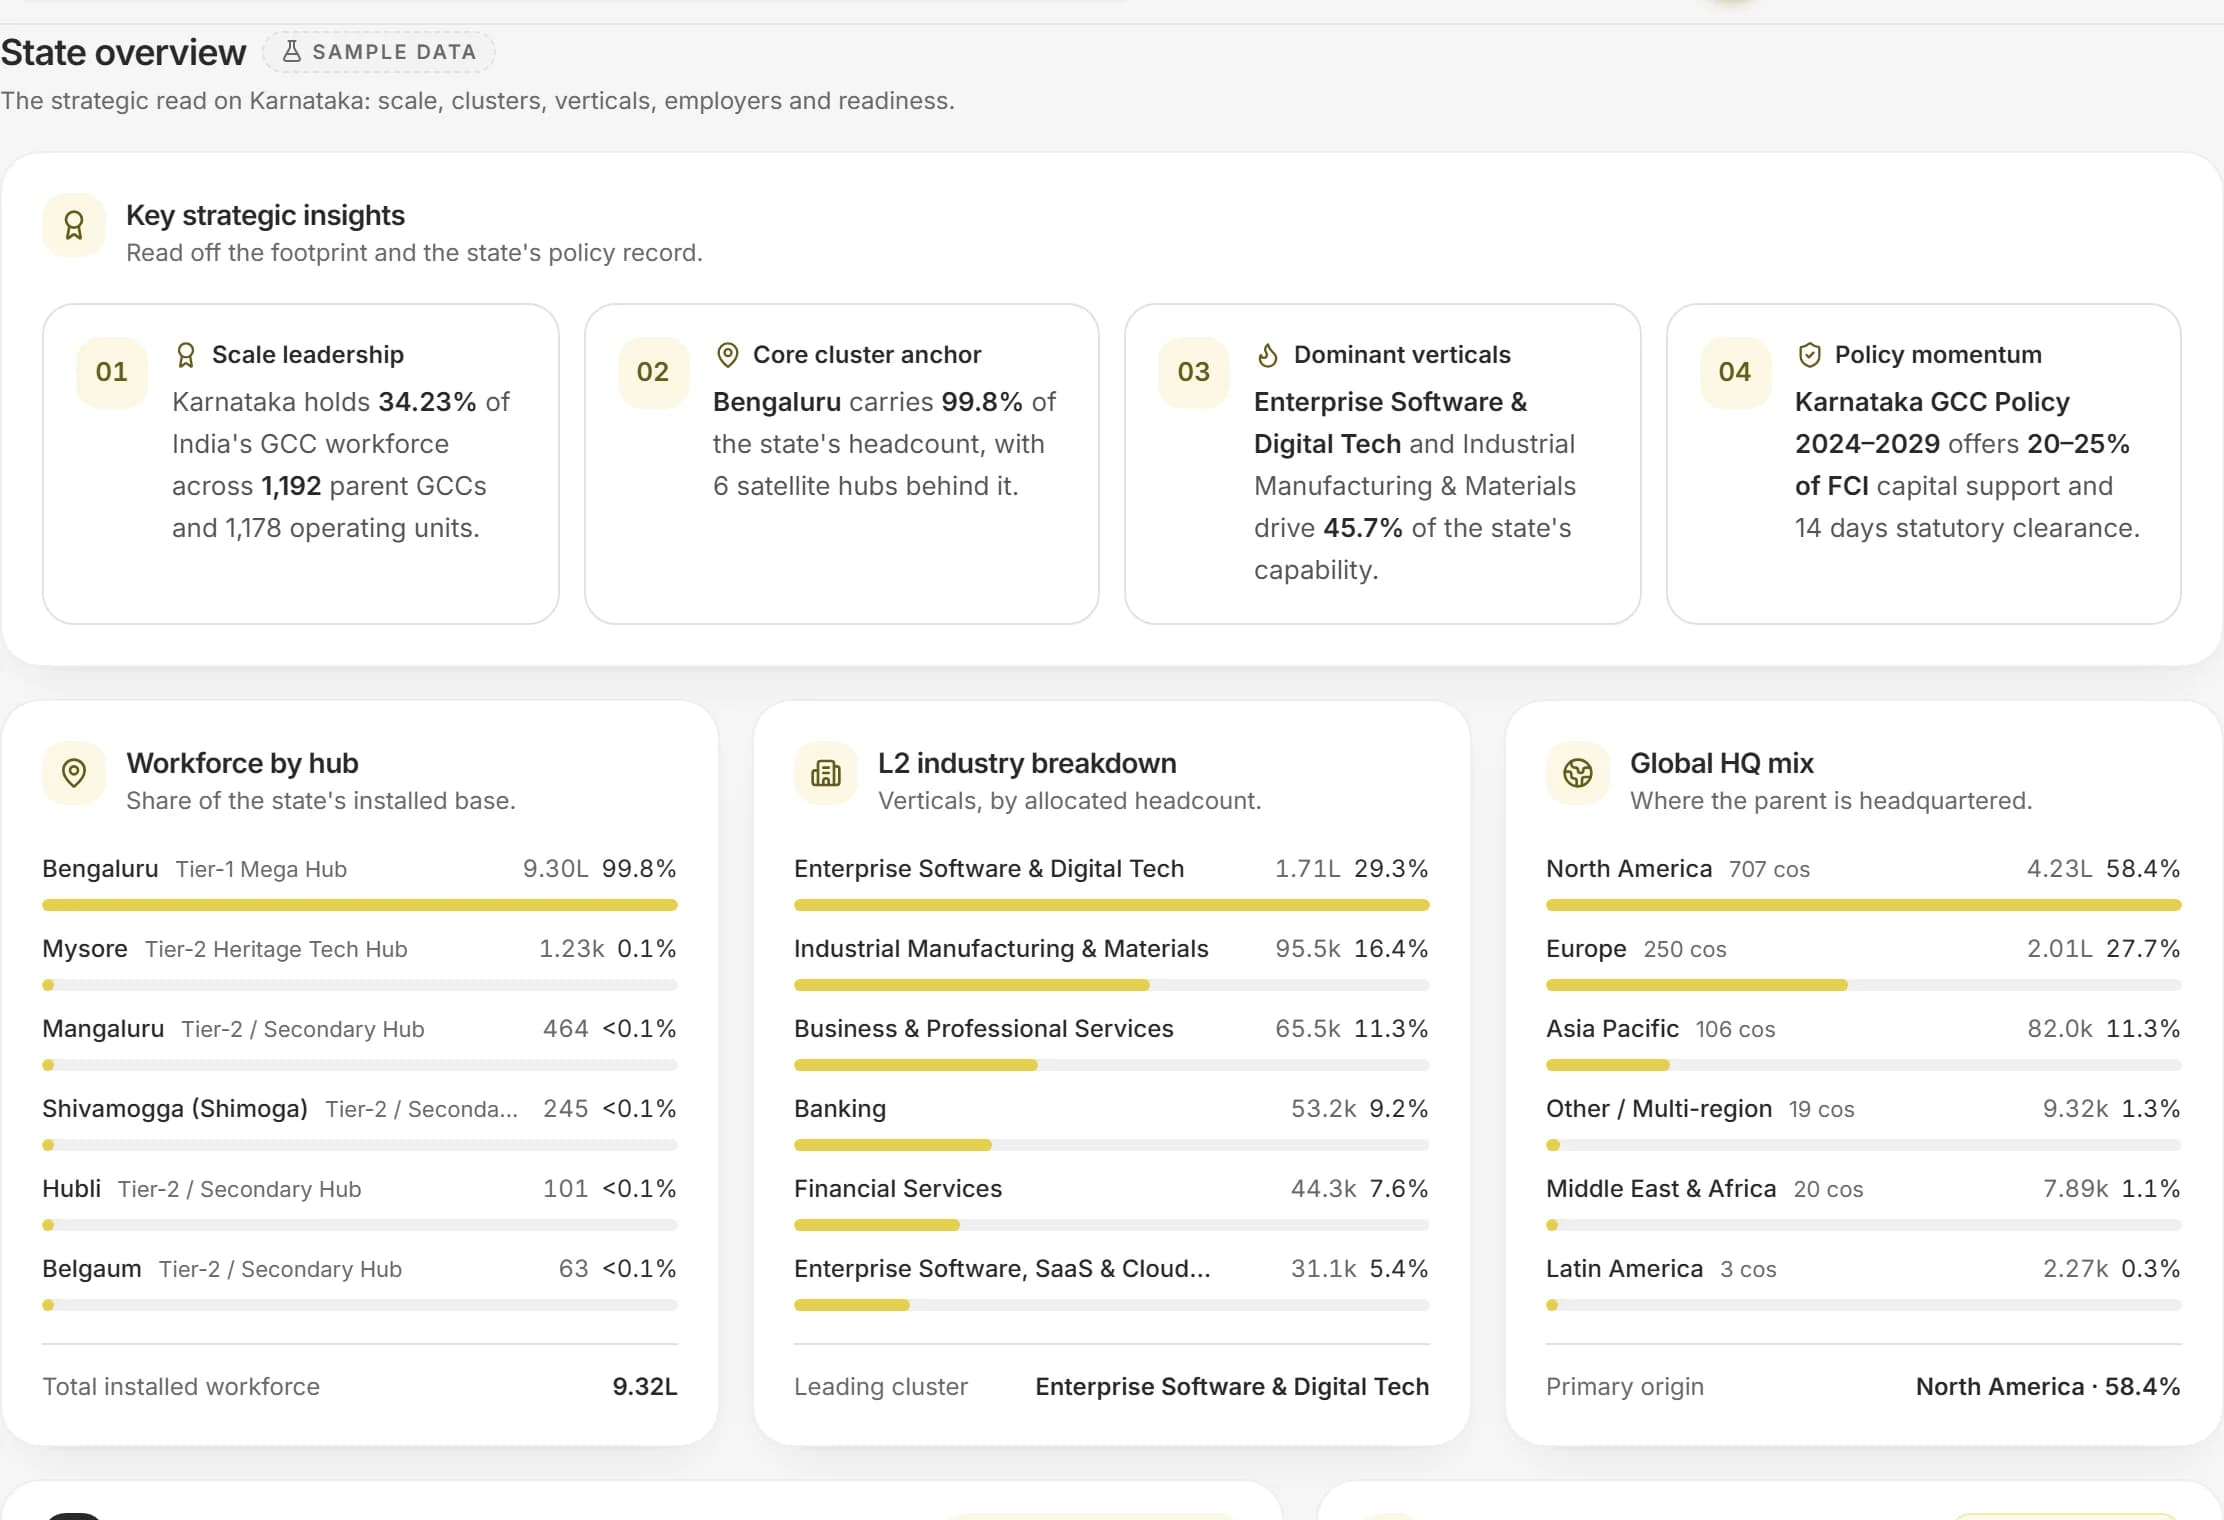 Sample data
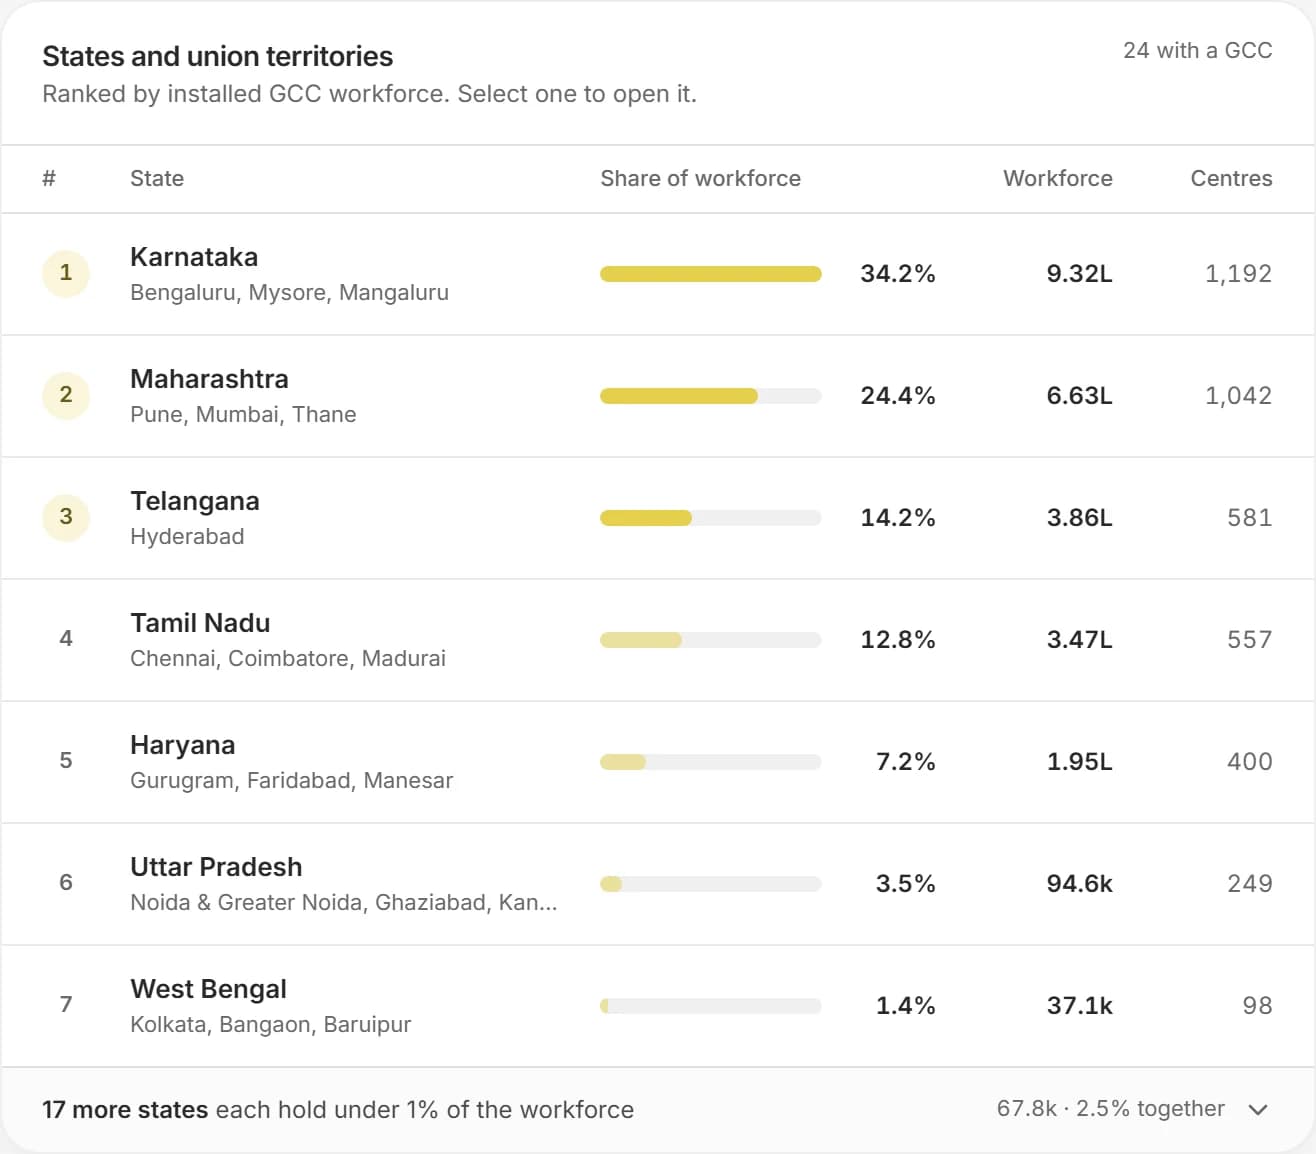
- State and city profiles with centre counts
- Side-by-side comparison of states and hub cities
- Policy matrix and announced new centres by city
The GCC list this page draws on.
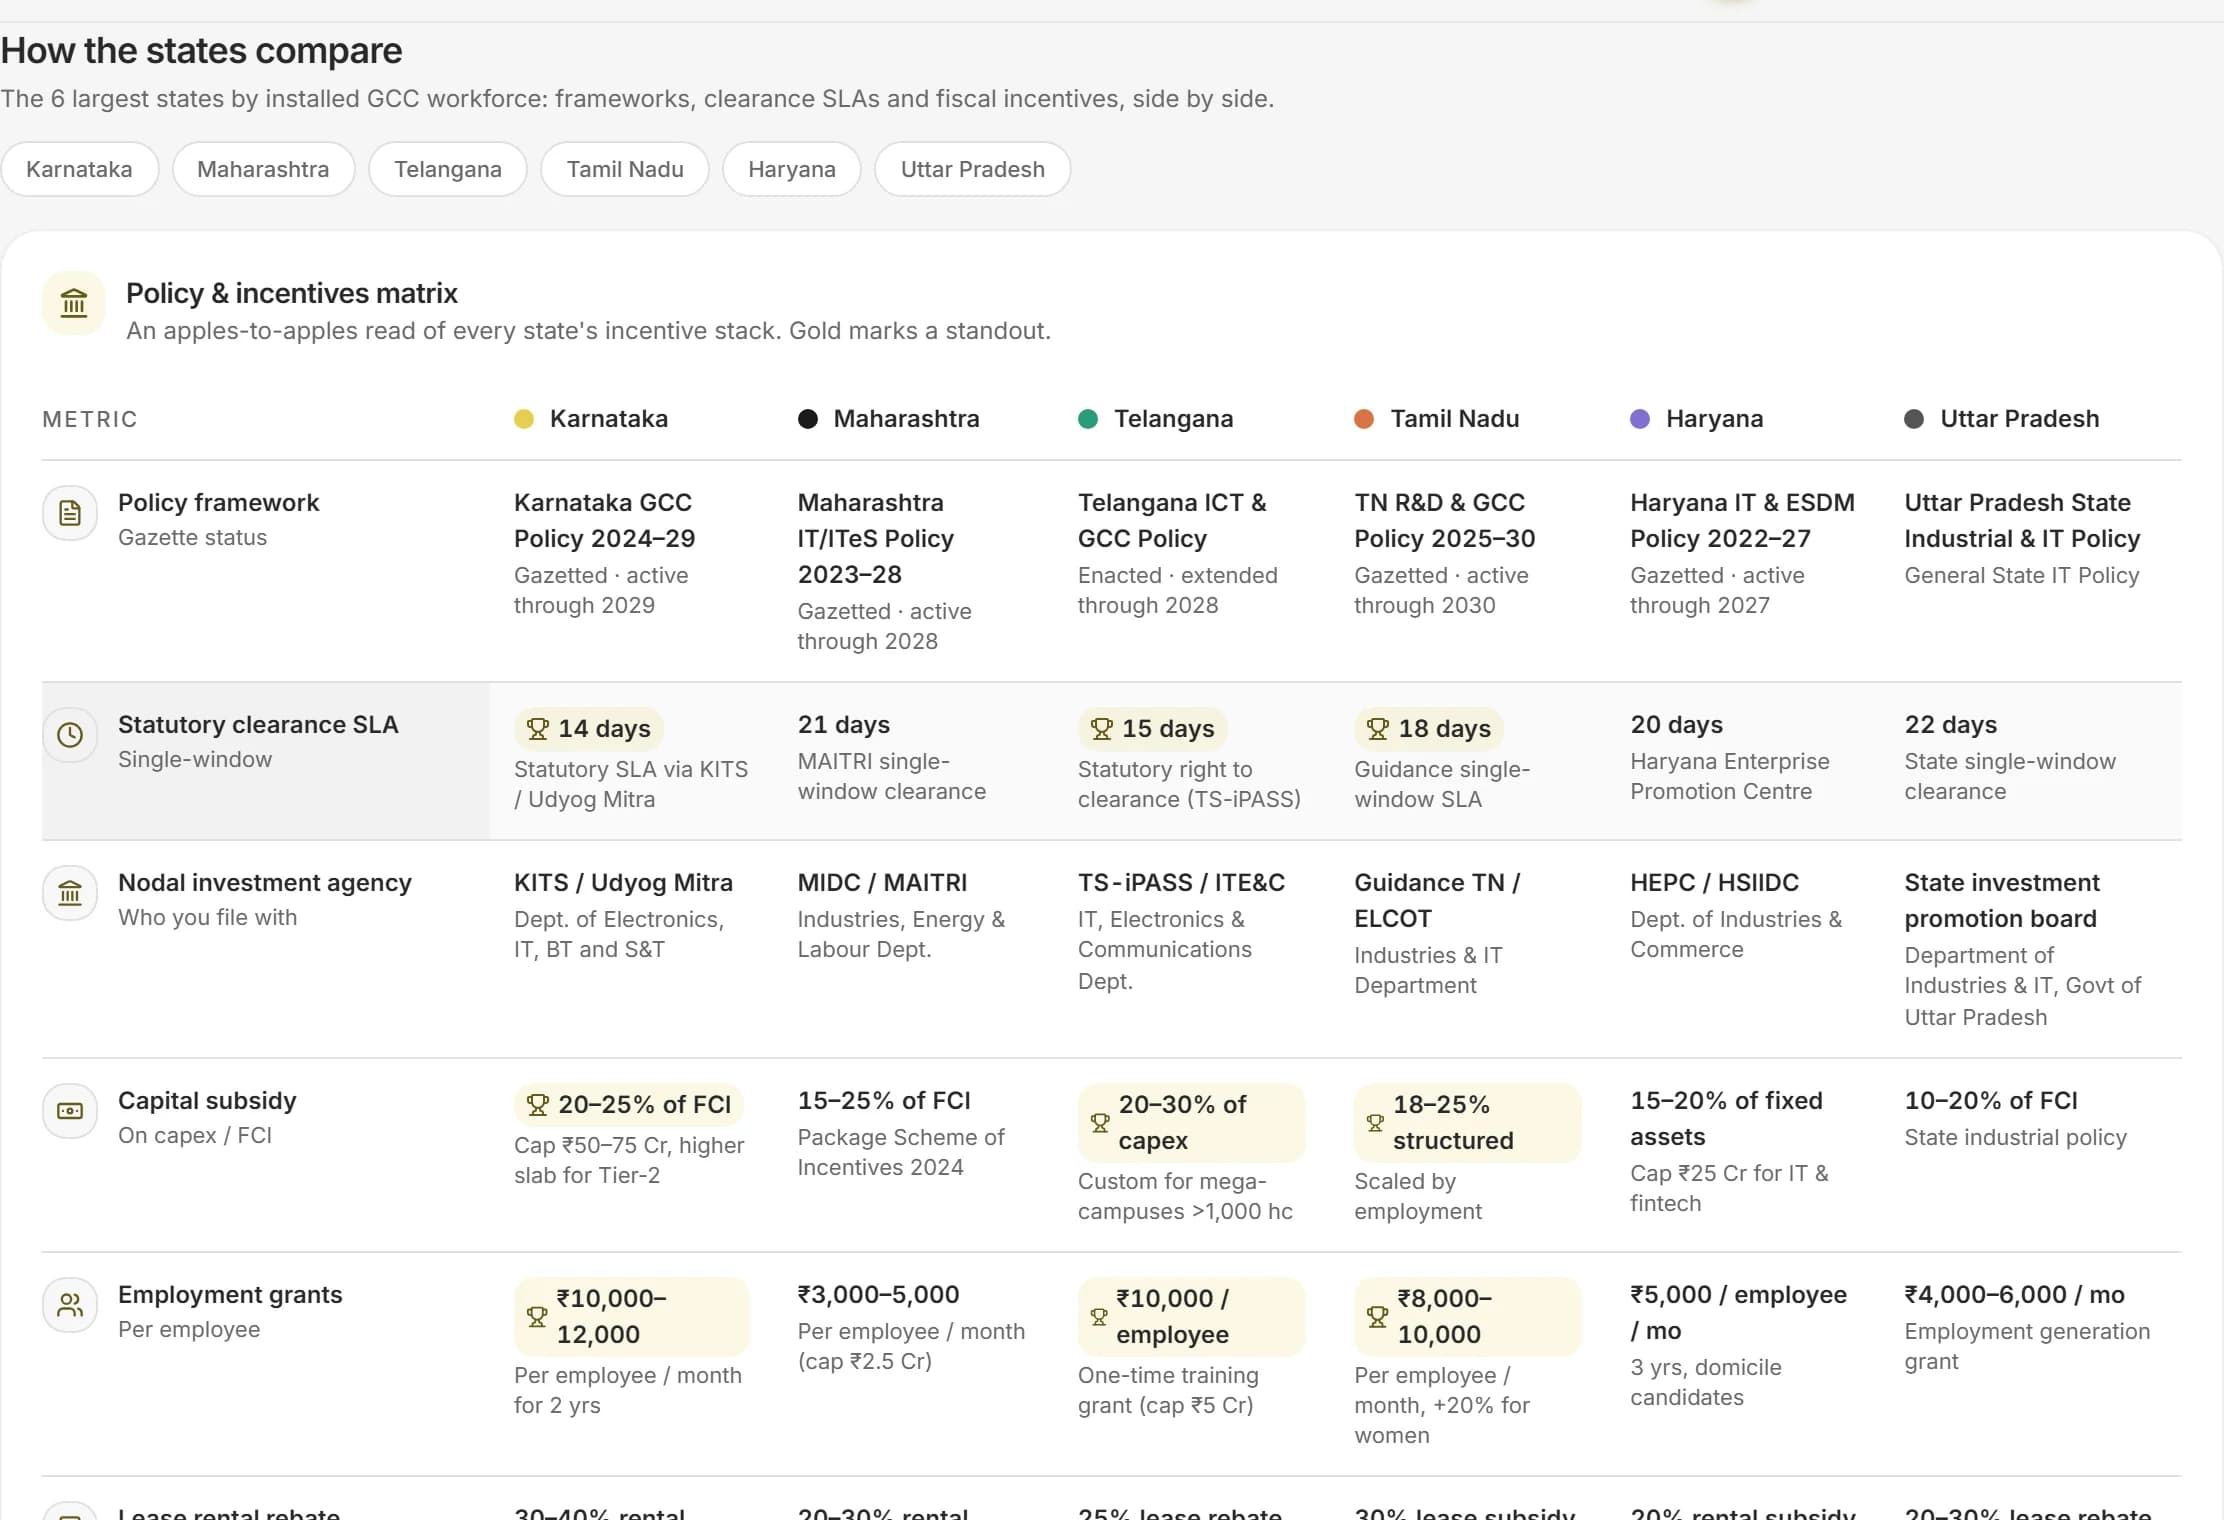 Sample data
Incentives compared across states.
A screen from the product itself. The counts beside it are read from the platform directory.
- 35
- Indian cities with a centre
- 4,439
- GCC centres
- 18
- states and union territories
- 2.85M
- people in GCCs across India
Location Intelligence, in four parts.
Each part is something the product does today, with the data it uses named on the page.
State profiles
Centres, workforce share, leading industries, top employers and an ecosystem-readiness view for each state.
Hub comparison
Put hub cities next to each other on capability depth, annual pay for the same role and band and hiring activity.
Policy matrix
State GCC policy compared across states: what is offered, the clearance steps and where the terms differ.
Where new centres land
A ranked league of cities by announced new GCCs, with the companies behind each, from the news pipeline.

The market, company by company.
Every GCC on the list has a profile, and every profile rolls up into the cities, industries, skills and pay layers you filter by. Start from the whole market and narrow to one company, or start from one company and see the market around it.
Request access- 0
- Mega GCCs, over 10,000 people each
- 0
- Platform industries
- 0.0%
- Of the workforce is in mega GCCs
- 0
- GCCs set up since 2021
From a country view to a street-level shortlist
The module is built to narrow, in this order.
- Step 1
India overview
Where centres concentrate by state and city.
- Step 2
State profile
Industries, employers and readiness for one state.
- Step 3
Compare
States or hub cities side by side, with pay for the same role.
- Step 4
Policy and news
Incentive terms, and which cities are winning new centres.
Ask the question the way you would ask a colleague.
These are the kinds of questions this page is built for. Each one is answered from the data on it, not from a general model of the market.
Which states host the most GCCs and which industries lead in each?
How do Karnataka, Telangana and Tamil Nadu compare on pay for the same role?
Which hub is cheapest for a given role, and which is the most crowded?
What does each state's GCC policy offer?
Which cities have the most newly announced centres this year?
How do Tier 1 and Tier 2 cities differ on the same measures?
From first look to a decision you can show.
Begin with the map
See where centres concentrate.
Open a state or city
Read its industries, employers and readiness.
Compare
Set two or more places side by side.
Check policy and news
Confirm incentives and announced centres before you commit.
Built for the people who own the decision.
Site-selection and strategy teams
A structured way to compare places.
State and economic-development analysts
Where the market sees momentum.
Real-estate and advisory teams
Which cities are winning centres.
What is in it, and what is not yet.
We say plainly what the data holds today and what we are still adding, so nothing here is implied.
- State and city profiles across 35 Indian cities with a GCC centre
- Hub and state comparison with annual pay for the same role
- State GCC policy matrix
- New-centre league by city with Tier 1 and Tier 2 views
- Lease cost per seat by micro-market
- Attrition by city
The terms on this page, defined.
Every figure on a CapSight page comes with its definition, so you never have to guess what a number is counting.
- GCC
- A Global Capability Centre: a centre a company runs in India for its own global work, such as engineering, analytics, finance, operations or support. It is part of the company, not an outside vendor.
- Platform Industry
- The one industry grouping CapSight uses for every company, so a filter or a chart means the same thing on every page. There are 10.
- Tier 1 and Tier 2 cities
- Tier 1 is the eight established hubs: Bengaluru, Chennai, Hyderabad, Mumbai, Pune, Delhi NCR, Kolkata and Ahmedabad. Every other city is Tier 2.
- Operating centre
- A company's presence in one city. A GCC with centres in three cities has three, which is why centres outnumber GCCs.
- Setup year
- The year a company set up its India GCC, where it is recorded: 1,895 of 2,500 companies have one. It is the basis of the setup eras the skyline shows.
- Median and percentiles
- The median (P50) is the middle value: half the sample sits below it. Percentiles show the spread around it, so a median is never quoted without its band.
Before you ask.
What counts as Tier 1?
Bengaluru, Chennai, Hyderabad, Mumbai, Pune, Delhi NCR, Kolkata and Ahmedabad. Every other named city is Tier 2.
How do new centres get counted?
One confirmed announcement counts once, under the city the story names, with Gurugram, Noida and New Delhi folded into Delhi NCR.
Is policy data current?
Policy records carry their verification status; stale or unsourced records are not used in reports.
Bring the GCC decision you are working on.
Where to put the next 300 engineers, what a peer pays its architects, who owns the charter you are selling into. Ask it in CapSight, and see the market, the peers and the people behind the answer.
Already on CapSight? Sign in
- 01Request access
We set up your organisation and its admin, who adds the team.
- 02Ask the question you have
Market, peer, pay or people, answered from one dataset.
- 03Walk it through with us
A 30-minute session with the research desk, on your decision.

Capability maturity of five BFSI GCCs in Bengaluru, by function.
Illustrative example